


🏴☠️ ⚡️ Issue #1: Setting Sail

Welcome!
You can expect to hear from me every other Fri AM with 1x of the following:
The hope here is to be as useful as possible to my fellow Micro SaaS enthusiasts, in both an investing and operating capacity.
(Feedback always welcomed and sincerely appreciated 🙏)
Go get ‘em this week!
🎯 Deal Tear Down
// FIRM PROFILE (PUBLIC LISTING)

Business management tool for photographers and other creatives
“Profitable SaaS with $263,834 in ARR and TTM revenue that is a powerful business management tool for photographers and other creative solo entrepreneurs. Started as a side project in 2007 to run the founder's wedding photography business, and launched out of beta in 2010, it’s continued to grow and develop in features and usability to be one of the leading tools in this space today.”
Asking Price: $636k
TTM Revenue: $226k
Founded: 2010
Revenue Multiple: 2.5x
TTM Profit: $159k
Team Size: 2
Product Stack: LAMP
// SV SCORECARD AVERAGE
💥 3.26 / 4
// STRENGTHS
Cash to execute our model — Healthy EBITDA margins (76%) and, although lower ARRs than our target range, existing cash flow is ample to cover both debt service and initial transformation activities related to: 1) buyer journey / funnel optimization and 2) testing new outbound acquisition channels to then invest budgeted marketing dollars in best performing, stacking profitable unit economics one channel at a time (paid search ads > outbound email > paid social ads)
Product Led / Non-linear Growth — Given the ideal customer profile (ICP) is solo / small team commercial photographers, we can assume very fast sales cycles that do not require human / sales intervention, which circumvents the need for sales capacity or headcount to scale revenue (eg. website visitor > trial > paid user)
Sticky as hell — End-to-end platforms that encompass customer workflows (CRM), billing / invoicing (Accounting) and team coordination (HCM) are extremely sticky, as it is essentially all three core pillars of a B2B tech stack, which makes it tricky to migrate to another tool(s). In addition, little risk of substitutes from cheaper point solutions, as this leaves the user tethering together a fragmented set of tools (a common ‘point vs platform’ pitch)
// RISK FACTORS
Stability of ARR — we’ll need to lean in to cohort analysis to ensure retention is not in structural decline and the business is default alive based on the status quo. As most micro SaaS firms have flat growth (new users = churned users), we need to build conviction that retention will hold constant as we scale new user acquisition or you’re only chasing an inevitable revenue plateau
Key Employee Risk — The Founder intends to leave the business after a 10yr run and he is 1 of 2 employees so have to assume he is intimately involved in product: 1) bringing domain expertise / persona empathy to the product road map and 2) acute institutional knowledge re the code base (frailties, tech debt, etc.)
Pandemic Sensitive — A spike in pandemic conditions / similar would dampen volume of events and thus the service providers that are the core customer base today
// QUICK WINS & OPPORTUNITIES
Alternative data sets — there are very prominent websites / marketplaces like The Knot & Zola that cater to weddings, etc., providing access to highly relevant data sets for targeting new customers
Channel Concentration — most participants in the events and event services business are very active on Instagram (essentially using the social network for free marketing); this would be the first channel to get after with outbound, then via influencer campaigns, and so on
Improving Trial Conversions — Depending on the visibility into usage data during a trial, we can more closely monitor a user’s behavior during trials to then programmatically trigger emails / notifications / prompts to drive actions we know lead to ‘aha moments’ (e.g. Facebook > 7 friends in 10 days > we got ya) or ‘hero feature adoption’
ICP expansion — once we have established predictable acquisition of the core ICP (solo / small team event photographers), we would sequence and prioritize the most similar adjacent markets (e.g. wedding bands / DJs) to expand / capture more of the addressable market. We’d use data to size up and prioritize the most appealing markets, then modify the playbook re pain points, channels to engage, etc. and let ‘er rip.
// MARKET COMPS
ARR: $150k to $350k
Asking Price: $1.11M
Revenue Multiple: 5.27x
TTM Profit Margin: 61%
Growth Rate: 80%
Conclusion:
The business commands a 76% margin, slightly above average. We can likely assume flat growth (TBD for now), as anything above 20% would expand the multiple significantly, more in line with what you see above. All things considered with the info available, 2.5x seems reasonable for this deal.
// RETURN SCENARIOS
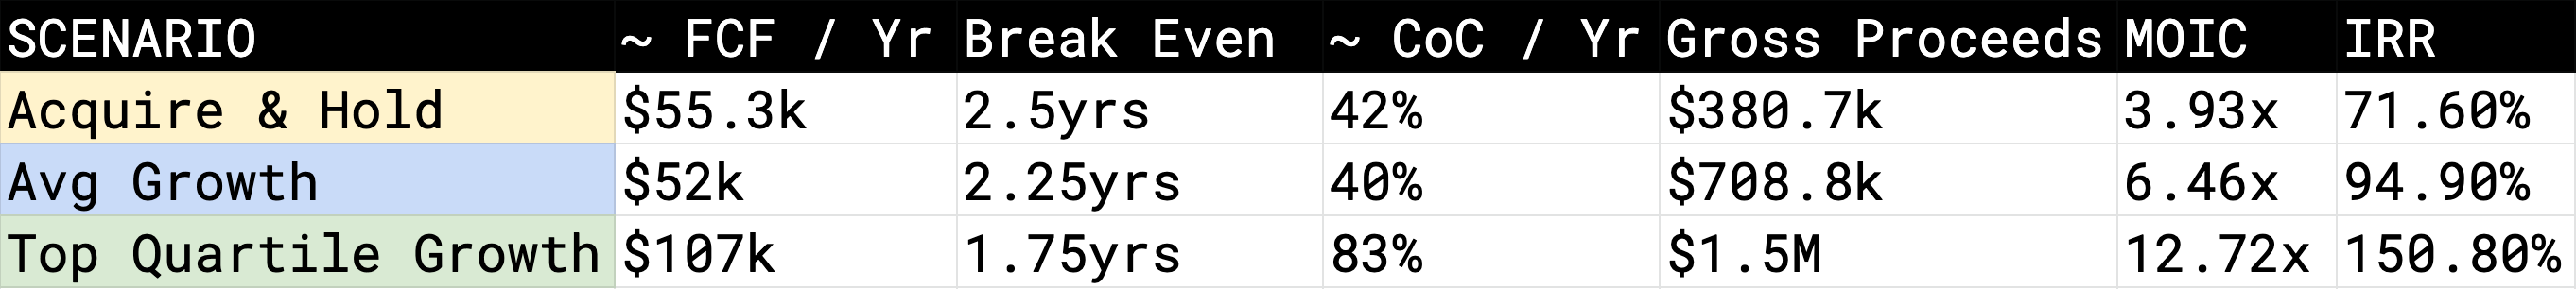
Assumptions —
All:
Cash Outlay / Equity (20%): $130k
Hold: 3yrs
Acquire and do nothing:
Median Mthly Churn Rate ($0-$25k MRR): 4.5%
Mthly Growth: 4.5% (0% Net)
Status Quo Costs (% of ARR): 37%
Exit Multiple: 2.5x
Average Growth:
Median Mthly Churn Rate ($0-$25k MRR): 4.5%
Median Mthly Growth ($0-$25k MRR): 5.75% (1.25% Net)
Status Quo Costs (% of ARR): 37%
Transformation Costs (% of ARR): ~9%
Marketing spend (% of ARR): 10%
Exit Multiple: 2.5x
Top quartile growth:
Median Mthly Churn Rate ($0-$25k MRR): 4.5%
Top Quartile Mthly Growth ($0-$25k MRR): 7.5% (3% Net)
Status Quo Costs (% of ARR): 37%
Transformation Costs (% of ARR): ~9%
Marketing spend (% of Sales): 10%
Exit Multiple: 3.5x
🤖 SaaS Playbook

RESOURCE: Use This Spreadsheet for Churn, MRR and Cohort Analysis
APPLICATION: Avoid being misled by headline metrics such as ‘net retention’ or ‘monthly churn’ by investigating usage and customer / revenue retention on a cohort-by-cohort basis (e.g. customers that signed up in January; customers on premium vs basic) to validate the health and ongoing stability of the business. The red flag to look for: net retention on the whole for the TTM is solid, but net retention is getting worse MoM for newer cohorts
🧐 Musings
“Don’t get so busy building the web, you forget to eat the fly.”
Operating leverage (ie for every 1x unit of effort, you get +1x units of impact / results) is typically a function of people, process and technology. Some might say, it boils down to systems and data.
For most of us, the tendency is to jump toward complex tech stacks and automations right out of the gate (as it’s the desired end state, after all). However, most processes require a number of iterations before you get it right and if these processes are now laced with automations and integrations, etc., iterating on a system becomes way more challenging.
Reminder to self: manual (within reason) is the way to go for the first few turns of anything. Once you enter the land of diminishing returns, tech stack-ify your heart out.
Great article, thanks for sharing!